

Blog
How does a dual-alternating work table improve utilization of car interiors cutting machines?

How does a dual-alternating work table improve utilization of car interiors cutting machines?
I still remember the first time a customer called us asking why their newly purchased dual-table cutting machine didn't "double the speed" as they expected. After reviewing their production data together, we discovered they had misunderstood how dual-alternating work tables actually improve utilization. The real benefit wasn't about cutting faster—it was about eliminating the idle time that happened every time they stopped to load or unload materials.
A dual-alternating work table improves car interiors cutting machine utilization1 by allowing one table to cut while the other loads or unloads materials simultaneously. This parallel operation eliminates machine idle time2 that occurs during material handling, but the improvement depends on your loading/unloading time relative to cutting time—not a simple speed doubling.
In our experience working with automotive interior manufacturers, the confusion around dual work tables comes from focusing on the wrong metric. Let me walk you through how these systems actually work and when they make sense for your production line.
What exactly happens during a single work table cutting cycle?
When we analyze customer production data, we break down each cutting cycle into distinct time phases. This breakdown helps us understand where time gets wasted.
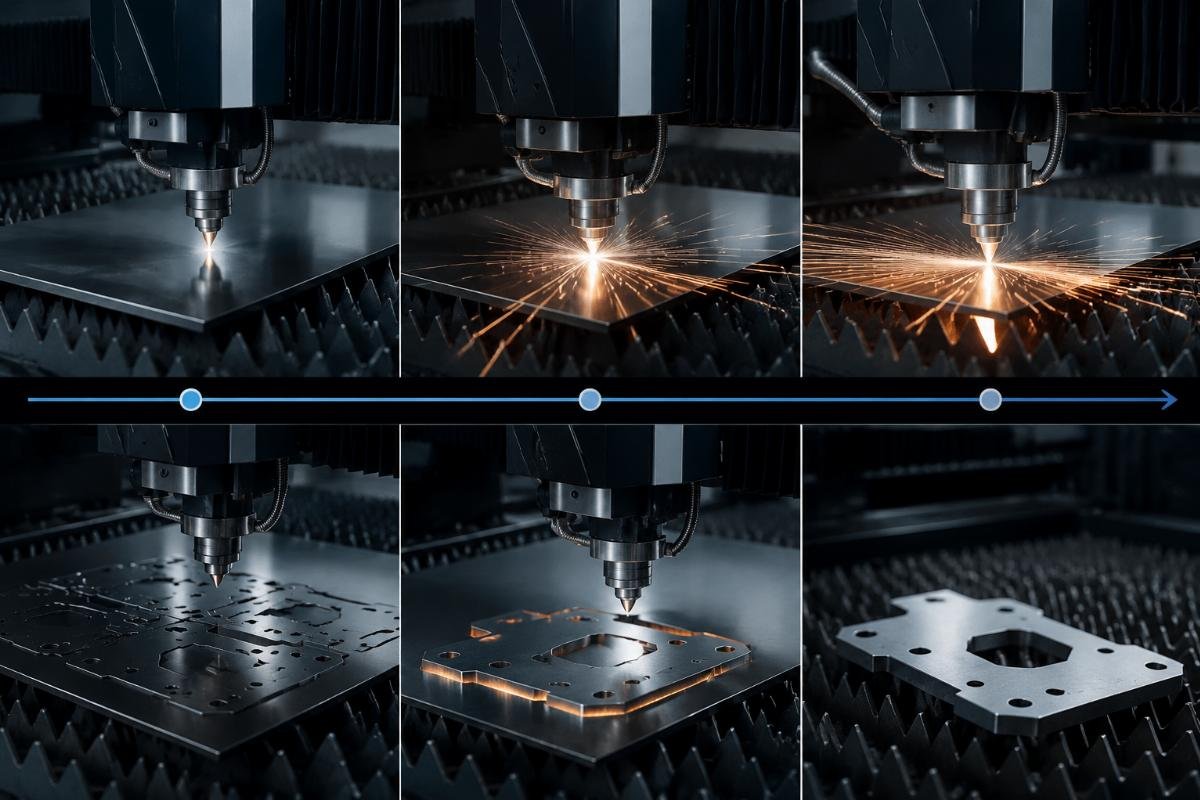
In a typical single work table setup, your machine goes through three phases: loading materials onto the table, cutting the materials, and unloading finished parts. During loading and unloading phases, your cutting system sits completely idle—the cutting head doesn't move, the vacuum system runs empty3, and you're essentially paying for machine time that produces nothing.
How much time actually gets wasted in typical automotive interior production?
Based on production data we've collected from our customers, the time breakdown varies significantly by product type.
For large automotive floor mats, we observed one customer's cycle looked like this: 8 minutes loading (positioning leather, activating vacuum, checking alignment), 12 minutes cutting, and 6 minutes unloading (releasing vacuum, removing parts, clearing scraps). Out of a 26-minute total cycle, the machine only cut for 12 minutes. That means 14 minutes—over half the cycle—was pure idle time.
For automotive headliners with complex contours, another customer reported: 5 minutes loading, 18 minutes cutting, 4 minutes unloading. Here the idle time was 9 minutes out of 27 total—still a third of the cycle wasted.
The pattern we see across automotive interior applications is that loading and unloading typically consume 30% to 60% of total cycle time4, depending on material type, part size, and operator skill level.
| Product Type | Loading Time | Cutting Time | Unloading Time | Idle Time Percentage |
|---|---|---|---|---|
| Floor mats (large leather) | 8 min | 12 min | 6 min | 53.8% |
| Headliners (composite) | 5 min | 18 min | 4 min | 33.3% |
| Seat leather (multiple pieces) | 6 min | 10 min | 5 min | 52.4% |
| Door panel fabric | 4 min | 14 min | 3 min | 38.9% |
How does the dual-alternating table eliminate this idle time?
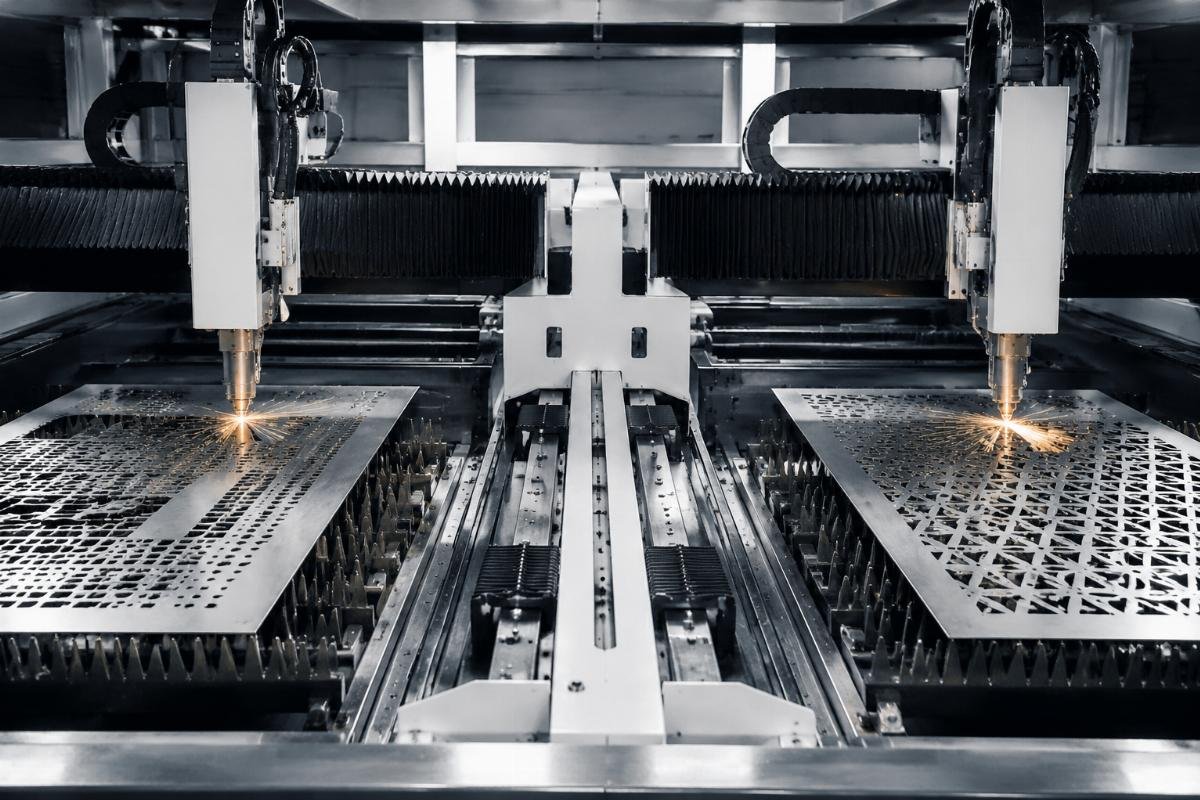
The core logic of dual-alternating work tables is simple but powerful. Instead of one table that forces the cutting system to wait during loading and unloading, you have two tables that take turns.
While Table A cuts, the operator loads material onto Table B. When Table A finishes cutting, the system immediately switches to Table B and starts cutting. Meanwhile, the operator unloads finished parts from Table A and loads new material for the next cycle. This alternating pattern keeps the cutting system continuously working—as long as your loading/unloading time doesn't exceed your cutting time.
What determines the actual utilization improvement you'll see?
In our customer cases, the improvement depends entirely on the relationship between your cutting time and your loading/unloading time.
Let's use real numbers from our floor mat customer. With their single table setup, here's what happened:
- Total cycle time: 26 minutes (8 loading + 12 cutting + 6 unloading)
- Cutting time per cycle: 12 minutes
- Pieces per hour: 60 ÷ 26 = 2.3 pieces
With dual alternating tables, the cycle changes completely:
- Table A cuts for 12 minutes while operator loads Table B (8 minutes) and unloads Table A (6 minutes)
- Total operator time: 14 minutes (8 + 6)
- Since operator time (14 min) exceeds cutting time (12 min), the bottleneck shifts to the operator
- Actual cycle time: 14 minutes per piece
- Pieces per hour: 60 ÷ 14 = 4.3 pieces
The improvement wasn't double (which would be 4.6 pieces), but it was 87% more output—from 2.3 to 4.3 pieces per hour. The machine utilization went from 46% (12÷26) to 86% (12÷14).
For our headliner customer with longer cutting time, the math worked differently:
- Single table: 27 minutes total (5 loading + 18 cutting + 4 unloading), 2.2 pieces/hour
- Dual table: 18 minutes per cycle (since 18 min cutting > 9 min loading+unloading), 3.3 pieces/hour
- Improvement: 50% more output
The key insight here is that dual tables help most when your loading/unloading time represents a large portion of your total cycle. When cutting time already dominates, the improvement becomes smaller.
When does the alternating system fail to improve utilization?
We need to be honest about scenarios where dual tables don't deliver the expected benefits.
If your loading and unloading combined take longer than your cutting time, the system can't maintain continuous cutting. The cutting head will finish Table A but have to wait for the operator to finish preparing Table B.
One customer producing custom automotive trim with frequent material changes experienced this problem. Their cutting time was only 6 minutes, but loading required 10 minutes (material selection, pattern verification, positioning multiple material types). The dual table system still had to wait 4 minutes between cuts. The improvement was minimal—from 16 minutes per cycle (single table) to 10 minutes per cycle (dual table), only a 60% improvement instead of the theoretical 167% if loading time equaled zero.
This situation occurs most often in small-batch, high-variety production where setup and verification time exceeds cutting time.
When do automotive interior manufacturers actually need dual work tables?
In our experience supporting customers, dual tables make sense in specific production scenarios—not as a universal upgrade.
Dual-alternating work tables become necessary when you face order volume that exceeds your current equipment capacity, your loading/unloading time consumes over 30% of total cycle time, you produce relatively standardized parts with consistent material handling processes, and you operate under tight delivery deadlines that justify the equipment investment.
What production volume justifies the dual table investment?
We typically see customers consider dual tables when they're running their single-table machines 16+ hours per day and still can't meet order demand.
One automotive seat leather supplier we worked with faced exactly this situation. They were cutting 180 seat sets per day on single-table machines running two 8-hour shifts. Their customer demanded 280 sets per day within three months. They had two options: buy a second complete cutting machine or upgrade their existing machine with dual tables.
The cost comparison looked like this:
- New complete machine: $85,000 plus additional floor space and operator
- Dual table upgrade: $32,000 using existing machine frame and one operator
They chose the dual table upgrade. After installation, their output increased from 180 sets to 295 sets per day—exceeding the customer requirement. The payback period was under 8 months5 based on the contracts they secured with increased capacity.
However, not every situation follows this pattern. Another customer producing small quantities of custom automotive carpets rejected dual tables after our analysis. Their average order size was 20-50 pieces per design, with 15+ different designs per week. The frequent material and pattern changes meant their loading time was highly variable and often exceeded cutting time. For them, the dual table investment wouldn't pay back within a reasonable timeframe.
How do you calculate whether dual tables will solve your bottleneck?
We recommend customers follow this decision framework based on data from their current production:
First, measure your actual cycle times over a full production week—not just ideal conditions. Record loading time, cutting time, and unloading time for each part type you regularly produce.
Second, calculate your current machine utilization. Divide actual cutting time by total cycle time. If this number is below 60%, you have significant idle time that dual tables could eliminate.
Third, project your required output increase. If you need to increase output by less than 30%, you might achieve this through operator training or process improvements without equipment investment. If you need 50%+ improvement, dual tables become economically attractive.
Fourth, verify that your loading plus unloading time doesn't exceed your cutting time by more than 20%. If it does, you'll still have idle time even with dual tables.
| Decision Factor | Favorable for Dual Tables | Unfavorable for Dual Tables |
|---|---|---|
| Current utilization | Below 60% | Above 75% |
| Loading + unloading vs cutting | Less than cutting time | Exceeds cutting time by 50%+ |
| Required output increase | 50% or more | Less than 30% |
| Production variety | Standardized parts | High-variety, frequent changes |
| Order volume stability | Consistent high volume | Variable, seasonal demand |
| Operator availability | Skilled operators ready | Training required |
What operational changes come with dual-alternating tables?
Installing dual tables changes more than just your equipment—it changes how your operators work.
With dual work tables, your operator's workflow becomes continuous and time-pressured6. Instead of loading, waiting during cutting, then unloading, they must constantly alternate between tables without breaks. This requires higher operator skill, better material preparation systems, and sometimes additional support staff to maintain the pace.
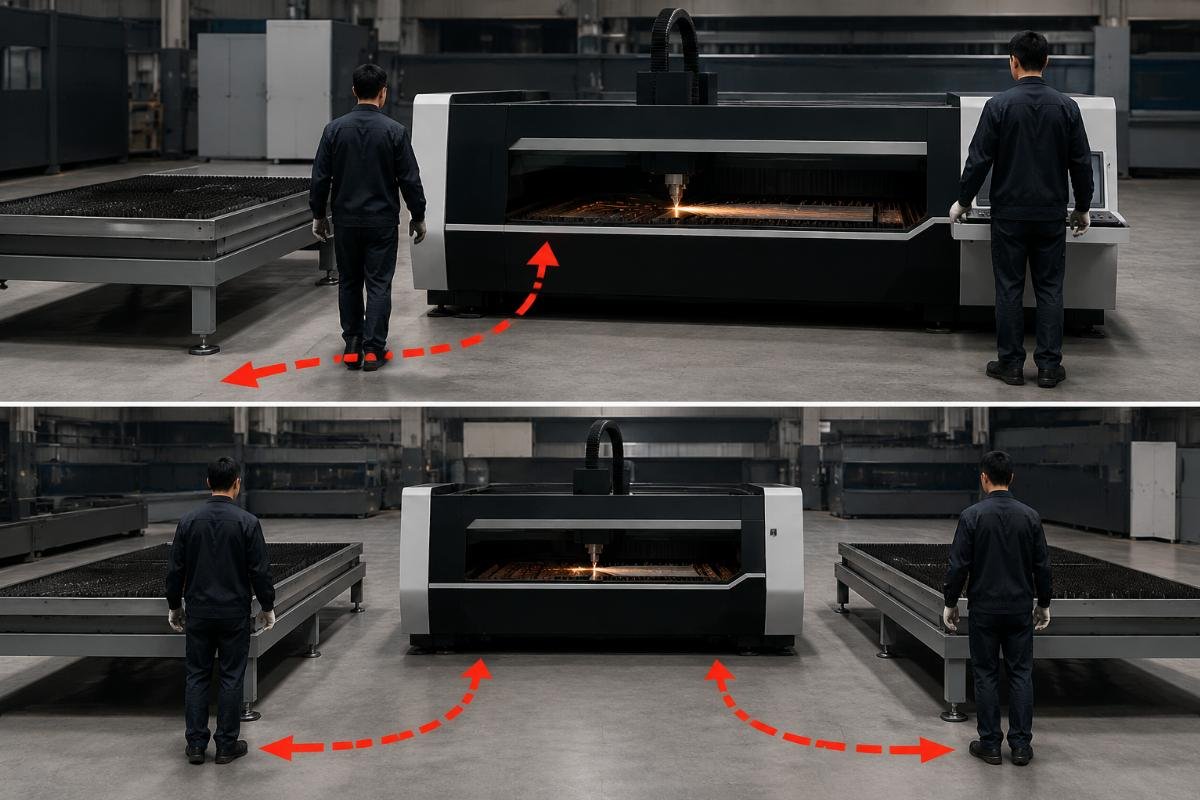
How do operator requirements change with dual table systems?
One of our customers learned this lesson through trial and error. They installed dual tables expecting immediate productivity gains but saw only 25% improvement in the first two months—far below the 70% we projected.
After investigating, we found the problem wasn't the machine. Their operator was highly skilled at the cutting process but had never worked with dual tables. She struggled with the constant table switching, sometimes losing track of which table needed what material, and occasionally starting a cut on an incompletely loaded table.
We recommended they implement three changes:
First, create a visual management system with color-coded indicators7 showing which table was cutting (red light), which was ready to load (green light), and which was ready to unload (yellow light). This simple addition helped the operator track the alternating cycle without memorizing states.
Second, reorganize material storage so the operator could access materials for loading without walking across the machine area. They added rolling carts positioned between the two tables with pre-cut materials staged in cutting sequence.
Third, add a second operator during peak production hours to handle material preparation while the primary operator focused on loading and unloading. This investment paid for itself within the increased output.
After these changes, their actual improvement reached 68%—close to our projection.
What happens when material handling becomes the new bottleneck?
This is the hidden challenge that surprises many customers after they install dual tables.
With single tables, the machine's idle time during loading and unloading gave operators time to prepare the next materials, check quality, clear scraps, and handle administrative tasks. With dual tables cutting continuously, all these activities must happen in parallel—or your increased cutting capacity creates chaos in material flow.
We saw this clearly with an automotive door panel manufacturer. After installing dual tables, their cutting capacity increased from 240 panels per day to 380 panels per day. But their material warehouse wasn't prepared to stage 380 panels worth of raw materials daily. They ran out of pre-cut material blanks by mid-afternoon, forcing the cutting machine to sit idle while warehouse staff scrambled to prepare more material.
They had solved the cutting bottleneck only to discover a material preparation bottleneck. Eventually they hired one additional warehouse person dedicated to keeping two days of material staged near the cutting machines.
This pattern repeats across our customer base: increased cutting capacity exposes weaknesses in upstream and downstream processes8. Dual tables are most successful when implemented as part of a broader production flow improvement—not as an isolated equipment upgrade.
How do maintenance requirements differ with dual work tables?
More work tables means more components that can fail, but the reliability math isn't as simple as "twice the parts, twice the problems."
Dual-alternating tables add mechanical table switching systems, additional vacuum zones, extra positioning sensors, and more complex control logic. These components require regular inspection and preventive maintenance. However, the actual failure risk depends more on cycle count (how often tables switch) than on component count alone.
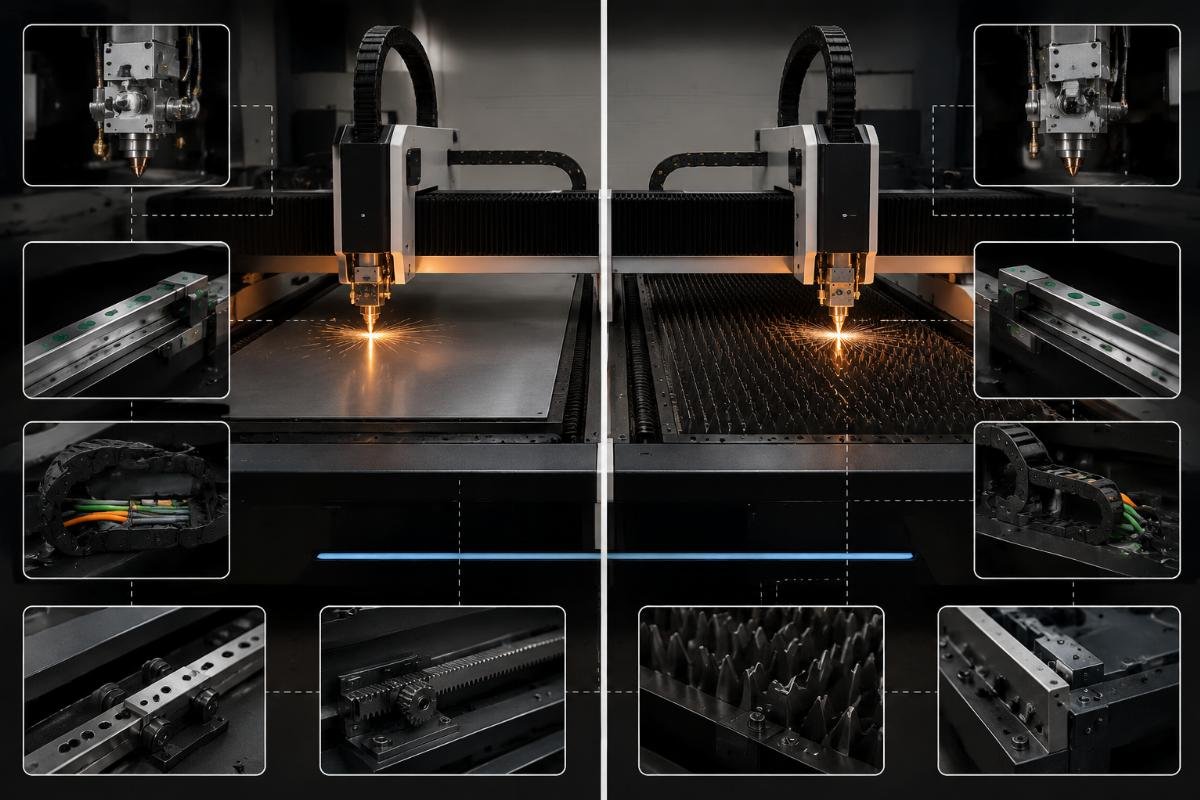
What components fail most often in dual table systems?
In our service data covering over 200 dual-table machines we've sold in the past five years, the most common service calls involve three specific component groups.
Table switching mechanisms fail most frequently—about 60% of our dual-table service calls involve these systems. The linear guides that move tables in and out of the cutting position experience high load cycles9. We see wear patterns develop after 80,000-120,000 switching cycles10 depending on table weight and material load. For automotive interior applications with average cycle times around 15 minutes, this translates to roughly 18-24 months before the first guide replacement becomes necessary.
Vacuum system valves rank second, representing about 25% of service calls. Dual tables use separate vacuum zones for each table, with automated valves that switch vacuum on and off during table changes. These valves cycle once per cutting cycle—far more frequently than most industrial vacuum applications. The valve seats wear gradually, leading to weak vacuum11 on one table while the other maintains full strength. Operators usually notice this problem when material starts lifting during cutting.
Positioning sensors account for about 10% of service issues. Each table has sensors that confirm it's fully locked in the cutting position before the cutting head will start. Dust and debris from cutting materials (especially leather dust and fabric fibers) gradually coat these sensors, eventually causing false readings. We recommend customers clean sensors weekly with compressed air as part of routine maintenance.
How much more does dual table maintenance cost annually?
Based on customer-reported maintenance expenses over a three-year period, dual-table systems cost approximately 40-60% more to maintain than equivalent single-table machines12.
A typical single-table automotive interior cutting machine costs customers around $2,800-3,500 per year in routine maintenance (blade replacement, vacuum pump service, lubrication, basic component wear). Dual-table systems cost $4,500-5,800 annually for the same maintenance scope plus dual-table-specific components.
However, this comparison misses the important context: output capacity. When we calculate maintenance cost per part produced, dual tables often show lower unit costs because their higher output spreads the maintenance expense across more parts.
One customer's actual data illustrated this clearly:
Single table: $3,200 annual maintenance ÷ 52,000 parts/year = $0.062 maintenance cost per part
Dual table: $5,100 annual maintenance ÷ 91,000 parts/year = $0.056 maintenance cost per part
The absolute maintenance cost increased by 59%, but the per-part cost decreased by 10% because output increased by 75%.
Conclusion
Dual-alternating work tables improve car interiors cutting machine utilization by eliminating idle time during loading and unloading—not by making the machine cut faster. The actual improvement depends on your specific cycle times, operator capabilities, and whether your material handling process can support continuous operation.
"Overall equipment effectiveness - Wikipedia", https://en.wikipedia.org/wiki/Overall_equipment_effectiveness. Machine utilization is defined in manufacturing engineering as the ratio of productive operating time to total available time, typically expressed as a percentage, and represents the proportion of time equipment spends performing its intended value-adding function. Evidence role: definition; source type: encyclopedia. Supports: the standard definition of machine utilization in manufacturing. ↩
"[PDF] Parallel pull flow: A new lean production design - SFA ScholarWorks", https://scholarworks.sfasu.edu/cgi/viewcontent.cgi?article=1038&context=forestry. Lean manufacturing principles establish that parallel work stations allow non-value-adding activities (such as loading and setup) to occur simultaneously with value-adding operations (such as cutting or machining), thereby reducing or eliminating idle time when the parallel activities can be completed within the primary operation cycle time. Evidence role: mechanism; source type: education. Supports: how parallel work stations reduce idle time in manufacturing. Scope note: This describes the general principle; actual elimination of idle time depends on the specific time relationships between operations ↩
"Proper technique using vacuum hold down with CNC router - YouTube",
. Vacuum hold-down systems in CNC cutting applications typically maintain vacuum pressure during material loading to secure materials once positioned, though the system performs no productive work during the loading phase itself; vacuum is released during unloading to allow part removal. Evidence role: mechanism; source type: other. Supports: how vacuum hold-down systems operate during material handling phases. Scope note: Specific operational sequences vary by machine design and material type ↩"[PDF] Design and Development of a Lean Material Handling System at a ...", https://repository.stcloudstate.edu/cgi/viewcontent.cgi?referer=&httpsredir=1&article=1003&context=mme_etds. Industrial engineering studies of manufacturing operations commonly find that material handling activities (loading, unloading, positioning) account for 25-65% of total cycle time in batch production environments, with the proportion varying by part complexity and material type. Evidence role: statistic; source type: research. Supports: typical proportion of material handling time in manufacturing cycles. Scope note: The cited range reflects general manufacturing operations rather than specifically automotive interior cutting machines ↩
"Finding the Payback for Smart Manufacturing - Machine Metrics", https://www.machinemetrics.com/blog/finding-the-payback-for-smart-manufacturing. Manufacturing industry analyses indicate that capital equipment investments typically target payback periods of 1-3 years, with productivity-enhancing automation projects sometimes achieving shorter payback periods of 6-18 months when they directly address production bottlenecks in high-volume operations. Evidence role: general_support; source type: research. Supports: typical payback periods for manufacturing equipment investments. Scope note: The cited range represents industry norms rather than validation of the specific 8-month claim ↩
"Human factors and ergonomics in the emergency department", https://pubmed.ncbi.nlm.nih.gov/12140500/. Ergonomics research on machine-paced work systems demonstrates that continuous operation without natural breaks increases operator workload and time pressure, as workers must maintain pace with machine cycles rather than self-regulating their work rhythm, which can affect both performance and fatigue levels. Evidence role: mechanism; source type: research. Supports: how machine-paced continuous workflows affect operator workload. ↩
"Patterns for Visual Management in Industry 4.0 - PMC", https://pmc.ncbi.nlm.nih.gov/articles/PMC8512411/. Visual management systems, a core component of lean manufacturing methodology, use color-coding and visual signals to communicate machine or process status at a glance, reducing cognitive load on operators and enabling faster response to changing conditions without requiring memorization of complex state information. Evidence role: mechanism; source type: education. Supports: how visual management systems support operator decision-making. ↩
"[PDF] Identification of Moving Bottlenecks in Production Systems", https://researchrepository.wvu.edu/cgi/viewcontent.cgi?article=11203&context=etd. The Theory of Constraints, developed by Eliyahu Goldratt, establishes that production systems are limited by their weakest constraint, and improving capacity at one stage without addressing system-wide flow will shift the bottleneck to another location, often exposing previously hidden constraints in upstream or downstream processes. Evidence role: mechanism; source type: education. Supports: how improving one process constraint affects overall system performance. ↩
"[PDF] A SYSTEMATIC METHODOLOGY FOR FATIGUE ANALYSIS OF ...", https://hammer.purdue.edu/articles/A_SYSTEMATIC_METHODOLOGY_FOR_FATIGUE_ANALYSIS_OF_MACHINE_ELEMENTS_WITH_CHARACTERIZED_DYNAMIC_LOADS/7774661/files/14485694.pdf. Linear guide systems experience wear through repeated load cycles due to contact stress between rolling elements and raceways, with wear rate dependent on load magnitude, cycle frequency, lubrication quality, and contamination levels; manufacturers typically specify service life in terms of travel distance or cycle count under specified load conditions. Evidence role: mechanism; source type: education. Supports: how cyclic loading causes wear in linear motion systems. ↩
"[PDF] Precision Machine Design – Linear Rolling Bearings", https://my.mech.utah.edu/~me7960/lectures/Topic8-LinearRollingBearings.pdf. Linear guide manufacturers typically specify service life ratings ranging from 50,000 to several million travel cycles depending on load class, precision grade, and operating conditions, with actual service life varying significantly based on maintenance practices, contamination exposure, and load characteristics in specific applications. Evidence role: general_support; source type: other. Supports: typical service life ranges for linear motion components. Scope note: The cited range represents general manufacturer specifications rather than validation of the specific 80,000-120,000 cycle claim for table switching applications ↩
"[PDF] Aging and Service Wear of Solenoid-Operated Valves Used in ...", https://www.nrc.gov/docs/ML0412/ML041280161.pdf. In pneumatic and vacuum valve systems, the sealing surface between valve seat and closure element experiences mechanical wear and potential contamination buildup through repeated cycling, which gradually increases leakage past the seal and reduces system pressure or vacuum level, with wear rate accelerated by particle contamination, improper lubrication, or excessive cycling frequency. Evidence role: mechanism; source type: education. Supports: how valve seat wear affects vacuum system performance. ↩
"Maintenance Costs and Advanced Maintenance Techniques ... - PMC", https://pmc.ncbi.nlm.nih.gov/articles/PMC9890517/. Manufacturing equipment maintenance cost studies indicate that systems with additional automated components, motion systems, and control complexity typically incur 30-70% higher annual maintenance costs compared to simpler baseline configurations, due to increased parts count, more frequent service intervals for high-cycle components, and greater technical complexity of repairs. Evidence role: general_support; source type: research. Supports: relationship between equipment complexity and maintenance costs. Scope note: The cited range represents general relationships between complexity and maintenance cost rather than specific validation of dual-table cutting machine costs ↩